
As agents who are out in the field daily, we see firsthand how Manhattan’s real estate market is seasonally shifting. While the data continues to evolve, here’s what we’re seeing right now: supply is steadily rising, buyer interest is growing, and mortgage rates are at 18-month lows. Let’s take a closer look at the factors affecting the NYC real estate this fall.
Supply Overview
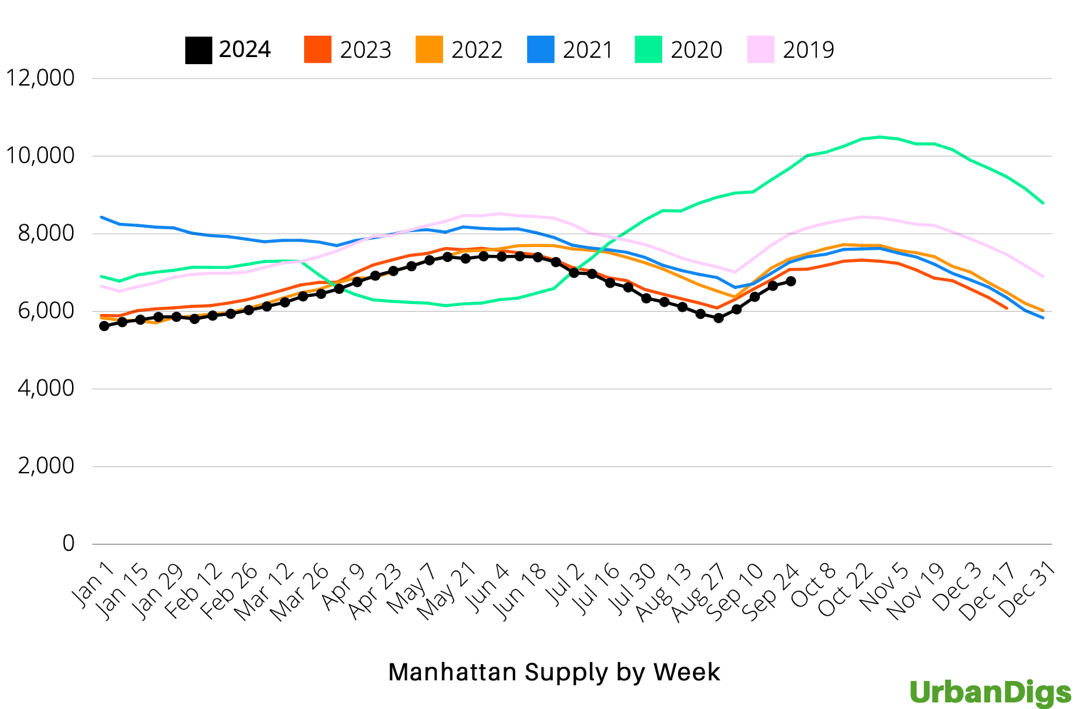
Current supply is sitting at 6,781 units, with a continuing rise but at a slower pace. This week saw nearly a 2% increase in new listings. While we’re still below the 7,000-unit threshold, expectations are that supply will continue its upward trend until the end of October. Last year, supply peaked around 7,500 units, and that’s the target for this fall. However, the trajectory may not be as steep as last year, indicating a potential shift in the market dynamics.
https://www.urbandigs.com/
Demand and Contract Activity
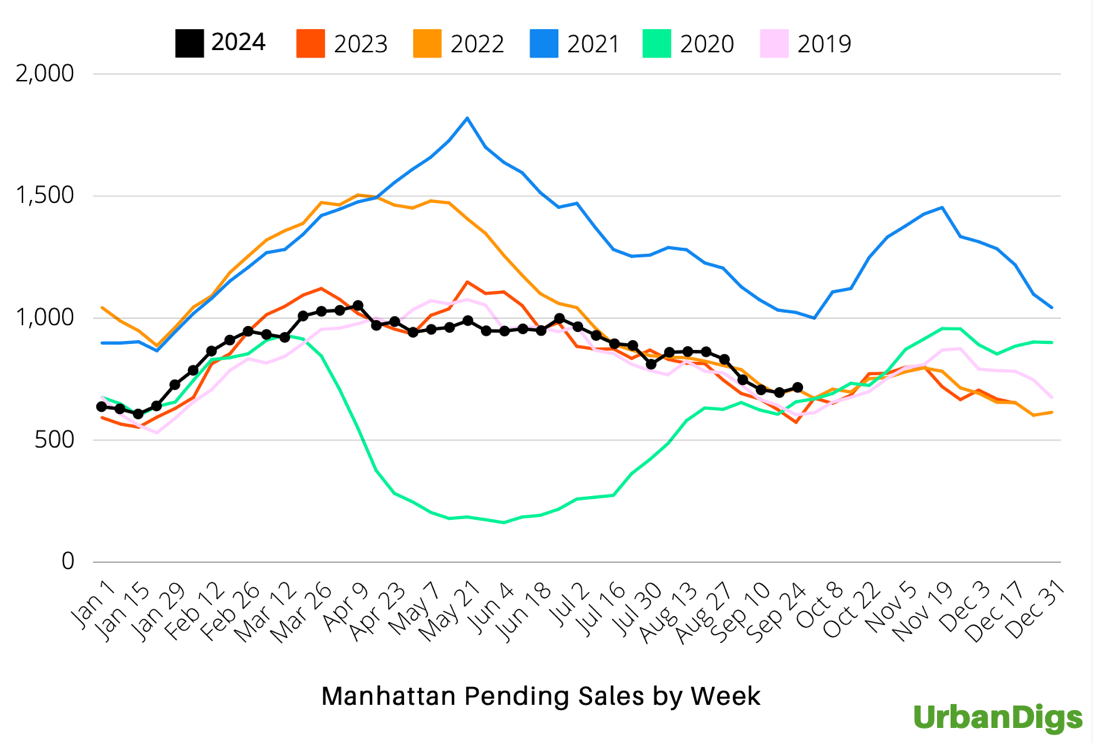
Demand, measured by the number of contracts signed in the past 30 days, is holding steady. With 715 contracts signed, this represents a 3% week-over-week increase. The figure is nearly 25% higher than where it was the same time last year, and the market is heading into the busier fall season. Notably, contract activity typically ramps up in late September, and early indicators suggest strong momentum, as anecdotal reports indicate positive buyer interest. If demand continues to perform above seasonal trends, September 2024 will be the first month since May 2023 that such a pattern has occurred.
https://www.urbandigs.com/
Price Action: What’s Happening Now?
Since the market peak in 2015-2016, prices have largely plateaued. Even with the sharp but brief downturn during the pandemic, prices rebounded by early 2021. Now, the market seems to be entering a more neutral phase in terms of price movement. However, this doesn’t capture the full picture.
From 2013 through the peak of 2015, a number of macro and micro factors have influenced the Manhattan market. These include the SALT deduction cap, overseas capital controls, the mansion tax, rent regulations, the rise of remote work in the commercial sector, the pandemic, and Local Law 97 on building emissions, to name a few. Any one of these forces could have affected the market, but together, over time, one might expect a more significant impact. Surprisingly, while the listing environment has noticeably shifted, the effect on pricing has been more nuanced.
Listing Climate: Sellers’ Challenges
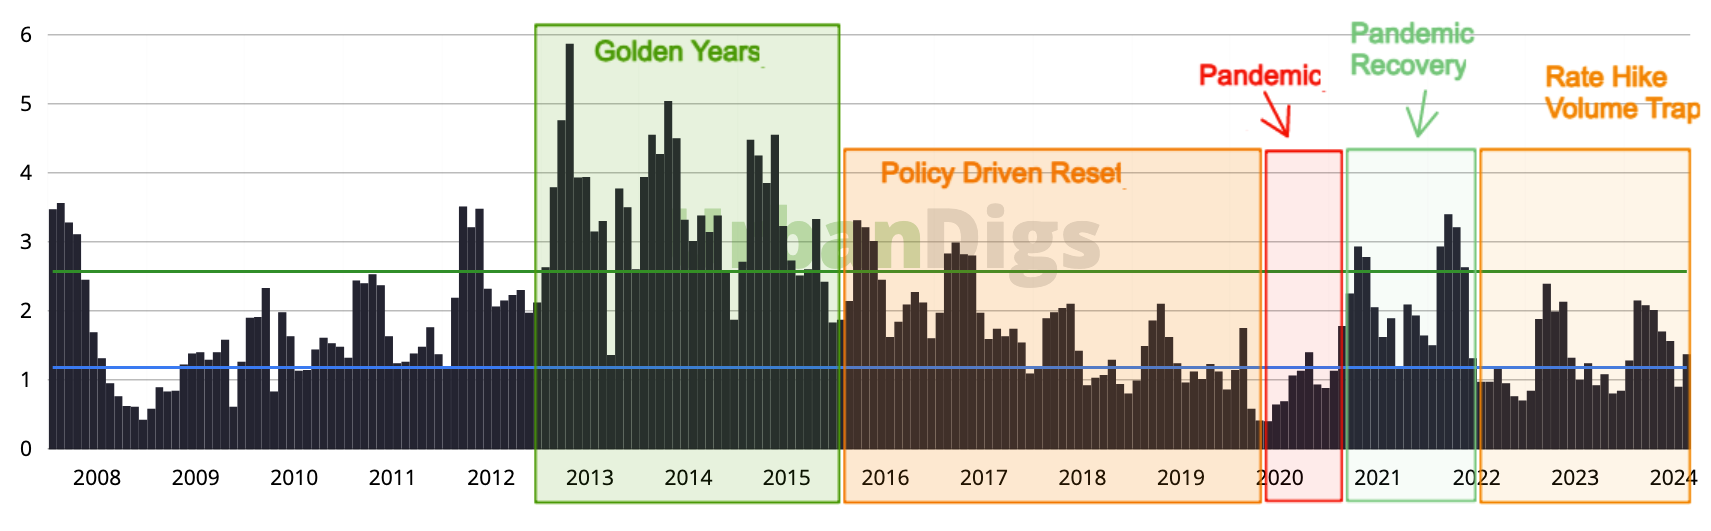
A closer look at the past decade shows the current market remains a tricky environment for sellers. For over two years, we’ve been in what we’d call a “challenging” listing climate. This period is notably tougher than even the peak recovery years of 2021 and 2022 post-pandemic—and far more difficult than the “golden years” of 2013 to 2015. Interestingly, while prices have been overall trending lower, they haven’t plunged. In fact, pricing seems to be holding up better than one might expect, even with the difficulties in the current listing climate. It suggests that the overall strength of the market is withstanding the pressures from various policies and economic forces.
There are multiple factors that could play a role in shifting us back to a more positive trend. Things like policy changes (the return of SALT deductions), a recovery in commercial occupancy and rents or a boost in foreign investment, could all potentially push pricing upward. Until then, pricing remains balanced, while listing conditions lean toward a more challenging side.
Courtesy of UrbanDigs: https://www.urbandigs.com/
The above Climate Index chart is one tool used to show how favorable or challenging the listing environment is for sellers by examining the ratio of signed deals to listings removed from the market. The ratio shows the following:
- A higher number could indicate a warmer, easier listing environment
- A lower number could indicate a cooler, more challenging one
This chart is meant for sellers looking to understand the current market climate and strategize their listing and pricing approach. It can also be valuable for buyers to gauge seller motivation and changing market conditions.
For Sellers: Maximizing the Fall
The fall season is off to a promising start compared to last year, partly thanks to lowered financing costs for buyers. Interest rates are at 1.5-year lows, and deal activity is returning to more typical seasonal levels. That said, it’s important to be strategic—this is not the time for “testing” high prices. Doing so could cost you the benefit of the initial 30-day listing window, which is critical for creating buyer urgency. If you’re considering a price reduction, aim to do so by mid-October to take advantage of the remainder of the fall selling cycle. Once we hit Thanksgiving, expect overall activity to slow until Spring 2025.
For Buyers: Opportunities and Strategies
You may benefit from the financing rates compared to last year, but the overall leverage you enjoyed a few months ago in pricing has shifted somewhat. Inventory is expected to increase throughout September, as is deal activity. Sellers who price their properties right are getting strong interest and traffic out of the gate, making those properties more competitive for buyers. However, there are still potential opportunities in listings with higher days on market —often a sign of initial overpricing or a challenge, like the need for renovation, that might discourage some buyers.
We would be happy to have a deeper discussion if real estate is on your mind. Feel free to contact us anytime!